Introduction Analysis: temperature Analysis: relative humidity Analysis: wind direction Analysis: wind speed Forecast Summary
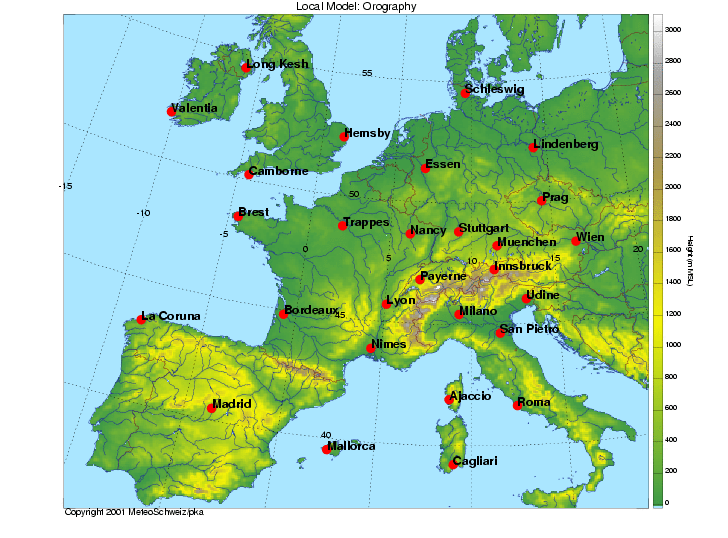
Figure 1: aLMo model domain with stations used for upper air verification.
The statistics used for this investigation is based on aLMo runs for
April to August 2001, so the results are certainly sound from a statistical
point of view.
Figure 2: Verification (mean error and standard deviation) of temperature
at midnight (forecast time +00 hours) for all stations. Nudging scheme
in blue, interpolation from GME in red.
Figure 3: Verification (mean error and standard deviation) of temperature
at midday (forecast time +00 hours) for all stations. Nudging scheme in
blue, interpolation from GME in red.
The same can be seen when only considering stations close to the alps
(Payerne, Lyon, Muenchen, Innsbruck, Udine, Milano; midnight,
midday), where the bias at midnight
is even more pronounced.
Figure 4: Verification (mean error and standard deviation) of relative
humidity at midnight (forecast time +00 hours) for all stations. Nudging
scheme in blue, interpolation from GME in red.
Figure 5: Verification (mean error and standard deviation) of relative
humidity at midday (forecast time +00 hours) for all stations. Nudging
scheme in blue, interpolation from GME in red.
Results are similar for the stations close to the alps (midnight,
midday),
where the effect near the ground is again stronger.
Figure 6: Verification (mean error and standard deviation) of wind
direction at midnight (forecast time +00 hours) for all stations. Nudging
scheme in blue, interpolation from GME in red.
Figure 7: Verification (mean error and standard deviation) of wind
direction at midday (forecast time +00 hours) for all stations. Nudging
scheme in blue, interpolation from GME in red.
Again, the same conclusions can be drawn from the stations close to
the alps alone (midnight, midday).
Note the severe bias in the lowest part of the troposphere, especially
at midnight.
Figure 8: Verification (mean error and standard deviation) of wind
speed at midnight (forecast time +00 hours) for all stations. Nudging scheme
in blue, interpolation from GME in red.
Figure 9: Verification (mean error and standard deviation) of wind
speed at midday (forecast time +00 hours) for all stations. Nudging scheme
in blue, interpolation from GME in red.
The respective results for stations close to the alps (midnight,
midday)
exhibit the same results.
Finally, note that all profiles (i.e. temperature, relative humidity,
wind direction and wind speed) are virtually identical from some levels
upwards, e.g. above 200 hPa for temperature or above 150 hPa for relative
humidity, no matter whether they are results of the nudging scheme or are
obtained from interpolated GME fields.
As an example, we show the temperature profile at midday for +12 hours
Figure 10: Verification (mean error and standard deviation) of temperature
at midday (forecast time +12 hours) for all stations. Forecast from nudging
scheme in blue, forecast from interpolated GME fields in red.
as well as the relative humidity
profile at midday for +12 hours.